When an environmental technician collects a grab water sample from a river on a Monday morning and sends it to a chemistry laboratory, the resulting data represents only a single, instantaneous snapshot in time. If an industrial plant dumped a slug of toxic chemicals at midnight on Sunday, Monday’s water chemistry test will frequently read completely clean! Chemical testing cannot capture episodic pollution events. Nature, however, provides a living, continuous monitoring network: benthic macroinvertebrates.
Benthic macroinvertebrates—bottom-dwelling aquatic organisms without backbones visible to the naked eye (>500 microns), including insect larvae, mollusks, and crustaceans—spend one to three years living directly on stream cobbles. Because they are relatively sedentary and exhibit diverse, species-specific physiological sensitivities to dissolved oxygen, thermal pollution, heavy metals, and fine sediment siltation, macroinvertebrate communities act as living tape-recorders of cumulative watershed health. In this monograph, we examine the quantitative mechanics of the EPT Index (% Ephemeroptera, Plecoptera, Trichoptera), the Hilsenhoff Biotic Index (HBI), multi-metric Indices of Biological Integrity (IBI), and D-frame kick-net sampling protocols.
The Ecological Rationale: Why Macroinvertebrates Outperform Chemistry
Aquatic entomologists and regulatory agencies (including the US EPA and European Water Framework Directive) rely on benthic macroinvertebrates as primary bioindicators due to four distinct ecological characteristics:
- Long Life Cycles (Temporal Integration): Many stoneflies and dragonfly nymphs spend 1 to 3 years as aquatic larvae. A severe pollution spill that lasted only 2 hours six months ago will have extirpated sensitive cohorts, permanently altering community structure long after the water has cleared.
- Sedentary Lifestyle (Spatial Fidelity): Unlike adult fish that swim away to escape localized pollution plumes, benthic macroinvertebrates cannot easily flee rapid chemical drops, providing precise spatial localization of pollution discharge sources.
- Wide Spectrum of Pollution Tolerances: Within a single gravel riffle, organisms range from hyper-sensitive stoneflies that die when dissolved oxygen drops below 7.0 mg/L to pollution-tolerant bloodworms (chironomids) possessing hemoglobin that thrive in near-anoxic sludge.
- Central Position in Aquatic Food Webs: Macroinvertebrates process primary producers and detritus, serving as the critical caloric bridge to fisheries, waterfowl, and riparian mammals.
The EPT Index: The Gold Standard of Stream Cleanliness
The most widely utilized rapid bioassessment metric is the EPT Taxa Richness Index, which tallies the total number of distinct families or genera belonging to three pollution-sensitive insect orders:
- Ephemeroptera (Mayflies): Nymphs possess three long caudal filaments (tails) and delicate abdominal gills. Highly sensitive to low dissolved oxygen and heavy metal contamination.
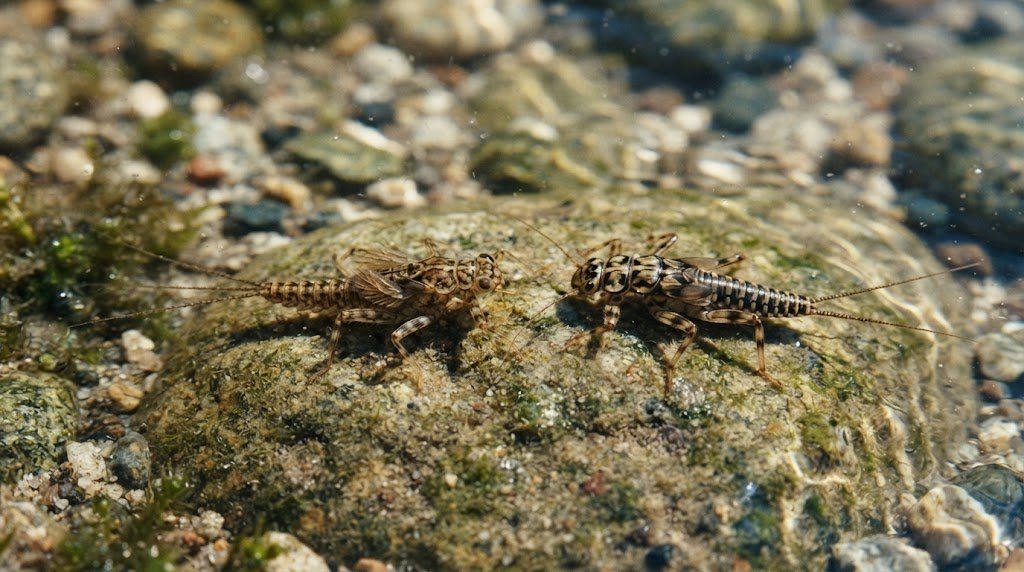
- Plecoptera (Stoneflies): Nymphs possess strictly two caudal filaments and two distinct tarsal claws. Stoneflies require cold, pristine, roaring water with high dissolved oxygen, making them the first group extirpated by agricultural runoff.
- Trichoptera (Caddisflies): Aquatic larvae famous for constructing architectural portable cases out of sand grains, twigs, and silk (or spinning fine underwater silk capture nets). Except for tolerant Hydropsychidae, most caddisflies demand clean, unsilted gravel beds.
A high EPT richness (>15 to 25 distinct taxa) signals a pristine, coldwater stream; an EPT richness below 3 indicates severe watershed impairment.
The Hilsenhoff Biotic Index (HBI) and Tolerance Values
While the EPT index measures simple taxonomic presence, the Hilsenhoff Biotic Index (HBI), developed by Dr. William L. Hilsenhoff at the University of Wisconsin in 1987, weights the abundance of every individual specimen against its species-specific Pollution Tolerance Value ($t_i$, scaled from 0 to 10):
HBI = Σ (ni * ti) / N
Where $n_i$ is the number of individuals of taxon $i$, $t_i$ is the assigned tolerance value of taxon $i$ (0 = hyper-sensitive; 10 = hyper-tolerant), and $N$ is the total number of individuals collected in a standardized 100-to-300 organism sample.
| HBI Score Range | Water Quality Classification | Degree of Organic Pollution | Typical Macroinvertebrate Assemblage |
|---|---|---|---|
| 0.00 to 3.75 | Excellent | Zero organic pollution apparent | Dominated by sensitive stoneflies (Perlidae), mayflies (Heptageniidae), glossosomatid caddisflies |
| 3.76 to 4.25 | Very Good | Slight organic pollution possible | High EPT diversity; diverse beetle larvae (Psephenidae – water pennies) |
| 4.26 to 5.00 | Good | Some organic pollution probable | Abundant net-spinning caddisflies (Hydropsychidae), dragonflies, damselflies |
| 5.01 to 5.75 | Fair | Fairly substantial organic pollution | Decline of stoneflies; scrapers replaced by collector-filterers and snails |
| 5.76 to 6.50 | Fairly Poor | Substantial pollution likely | Dominated by tolerant chironomid midges, scuds (Gammarus), blackflies (Simulium) |
| 6.51 to 7.25 | Poor | Very substantial organic pollution | Zero stoneflies; rare mayflies; abundant leeches (Hirudinea) and sowbugs (Asellus) |
| 7.26 to 10.00 | Very Poor | Severe organic pollution / Anoxic sludge | Monoculture of red hemoglobin-rich midge larvae (Chironomus riparius) and Tubificid worms |
Tolerance Mechanisms: Chitin Gills vs. Hemoglobin and Siphon Tubes
The extreme differences in macroinvertebrate tolerance values reflect evolutionary respiratory physiology:
- Stenothermic Oxygen Demand (Tolerance 0–2): Mountain stoneflies (such as Peltoperla) rely entirely on passive cutaneous gas diffusion across their thin chitinous body walls and filamentous gill tufts. In warm, low-oxygen water, they suffocate within minutes.
- Erythrocruorin Hemoglobin (Tolerance 8–10): ‘Bloodworms’ (larvae of the midge genus Chironomus) possess high concentrations of erythrocruorin hemoglobin dissolved in their hemolymph—the exact same respiratory pigment found in vertebrates! This high-affinity pigment allows chironomids to bind oxygen at vanishingly low partial pressures ($DO < 0.2 \text{ mg/L}$), surviving in anaerobic sludge where all predators have died.
- Atmospheric Breathing Siphons: Mosquito larvae (Culicidae) and rat-tailed maggots (Syrphidae: Eristalis) do not breathe dissolved oxygen at all; they extend specialized snorkel-like respiratory siphons through the surface film to breathe atmospheric air, thriving in raw septic wastewater!
Multimetric Indices of Biological Integrity (B-IBI) Scoring Protocols
Modern state and national environmental agencies (including EPA Rapid Bioassessment Protocols) integrate multiple individual metrics into a unified Benthic Index of Biological Integrity (B-IBI). Rather than relying on a single index, a standard multi-metric B-IBI integrates ten distinct ecological parameters, each scored from 1 to 5 relative to unimpaired ecoregional reference streams:
- Taxonomic Richness Metrics: Total Taxa Richness, Total Ephemeroptera Richness, Total Plecoptera Richness, and Total Trichoptera Richness.
- Tolerance / Sensitivity Metrics: Hilsenhoff Biotic Index (HBI), Percent Tolerant Organisms (taxa with tolerance values $\ge 7$), and Percent Dominant Taxon (which flags community imbalance).
- Functional Feeding Composition: Percent Shredders (evaluates riparian allochthonous inputs) and Percent Scrapers (evaluates periphyton balance).
- Habit Ecology: Percent Clingers (organisms adapted to clean cobbles, which plummet when sedimentation buries rocks).
Laboratory Specimen Processing and Taxonomic Quality Assurance
In professional benthic taxonomy, collected 500-micron kick-net samples preserved in 95% ethanol are processed under strict QA/QC protocols. In the laboratory, the sample is spread evenly across a gridded Caton tray, and random 2×2-inch grid squares are selected using a random number generator until exactly 300 individual organisms are extracted and identified to genus or species under high-magnification dissecting stereomicroscopes. A second independent certified taxonomist re-examines 10% of all samples to maintain a Percent Taxonomic Disagreement (PTD) of less than 5%.
Drift Dynamics: Behavioral vs. Catastrophic Invertebrate Drift
In lotic streams, benthic macroinvertebrates are not permanently anchored to cobbles; they exhibit a fundamental population-dispersal phenomenon called Stream Drift. Lotic entomologists classify drift into three distinct ecological modes:
- Behavioral (Diel) Drift: Occurs under cover of total darkness, peaking abruptly 1 to 2 hours after sunset. Mayflies (such as Baetis) deliberately release their tarsal grip on the rock and drift downstream with the current to escape localized food depletion or avoid visual-feeding predatory fish. After drifting a few meters, they grab onto a new cobble.
- Constant (Background) Drift: The continuous, low-level accidental detachment of individuals dislodged by turbulent flow eddies during normal foraging.
- Catastrophic Drift: Triggered by severe environmental stress: toxic chemical spills, flash floods, acid mine drainage pulses, or extreme sedimentation. Invertebrates abandon the streambed en masse in broad daylight, drifting by the millions downstream in a desperate effort to escape lethal chemical conditions.
Müller’s Colonization Cycle: How Streams Avoid Biological Depletion
If millions of insect larvae drift downstream every night, why do headwater streams not run completely out of insects over time? In 1954, Swedish limnologist Karl Müller formulated the Colonization Cycle: while juvenile nymphs drift downstream in the water current, mature winged adult females (mayflies, stoneflies, and caddisflies) emerge into the air and fly upstream against the wind along the forested river corridor, laying their eggs in pristine headwater reaches to replenish upstream populations.
Aquatic Ecological Survey Protocols and Laboratory Bioassessment
Operationalizing the principles of Benthic Macroinvertebrate Bioindicators in environmental impact assessments and conservation biology requires disciplined taxonomic rigor. Ecological communities fluctuate seasonally: benthic insects emerge as winged adults, zooplankton undergo boom-and-bust predator cycles, and submerged aquatic vegetation senesces in autumn.
A professional freshwater bioassessment integrates macroinvertebrate kick-net transects, pelagic zooplankton vertical tows, macrophyte rake surveys, and molecular environmental DNA filtering. Use the standardized bioassessment execution matrix below.
| Biological Assemblage | Sampling Hardware / Method | Field Collection Standard | Laboratory Taxonomic Processing | Ecological Metric & Assessment Index |
|---|---|---|---|---|
| Benthic Macroinvertebrates | 500-micron D-frame kick net | 1.0 m² riffle cobble kick (60 seconds); 3 replicates per reach | Sub-sample 300 organisms in Caton grid tray; identify to genus/species | EPT Richness, Hilsenhoff Biotic Index (HBI), B-IBI multi-metric score |
| Pelagic Zooplankton | 80-micron Wisconsin plankton net | Vertical tow from 1m above bottom to surface @ 0.5 m/s | Enumerate cladocerans, copepods, and rotifers in Sedgewick-Rafter cell | Daphnia biomass density; mean zooplankton body length (Trophic cascade metric) |
| Phytoplankton / Microalgae | Integrated 2-meter PVC euphotic hose sampler | Collect composite water across euphotic zone; preserve w/ Lugol’s iodine | Utermöhl inverted microscope settling chamber count @ 400x magnification | Chlorophyll-a concentration (μg/L); Cyanobacteria relative abundance (% HAB) |
| Submerged Macrophytes (SAV) | Double-sided metal sampling rake on pole/rope | Deploy rake along 100m transect lines at 1m depth increments | Estimate species percent cover; measure dry biomass (g/m²) | Floristic Quality Index (FQI); native vs. invasive macrophyte ratio |
| Environmental DNA (eDNA) | Peristaltic pump + 0.45μm PES capsule filter | Filter 1.0 to 2.0 L surface water; inject Longmire’s lysis buffer | Clean-room extraction; targeted TaqMan qPCR or NGS metabarcoding | Species presence/absence detection; absolute mitochondrial copy concentration |
Microscopic Enumeration Protocols in the Limnological Laboratory
Accurate quantification of microscopic aquatic communities requires specialized counting chambers and magnification optics:
- Sedgewick-Rafter Cell (Zooplankton & Large Algae): A glass slide holding exactly 1.0 milliliter of sample in a 50x20x1 mm chamber ruled into 1,000 grids. Examined at 100x to 200x magnification to calculate organisms per liter: $N = (C \cdot 1000) / (A \cdot D \cdot F)$, where $C$ is count and $F$ is concentration factor.
- Palmer-Maloney Cell (Nannoplankton): A shallow circular ceramic chamber holding 0.1 mL, optimized for high-power 400x phase-contrast identification of small flagellates and diatoms.
- Utermöhl Sedimentation Chambers: Water samples preserved with Lugol’s iodine settle by gravity down a vertical glass cylinder over 24 hours onto a thin glass coverslip, scanned from below using an inverted research microscope.
Frequently Asked Questions Concerning Freshwater Ecosystems & Bioindicators
Why are stoneflies (Plecoptera) the first group to disappear when a stream is polluted?
Stoneflies are coldwater stenotherms adapted to roaring mountain streams. Unlike tolerant insects that possess hemoglobin or breathe atmospheric air through siphons, stoneflies rely entirely on delicate external gills and cutaneous gas exchange. Even slight drops in dissolved oxygen or spikes in temperature suffocate them, making them the ultimate canaries in the coal mine for stream degradation.
How does biomanipulation clear a green, murky lake?
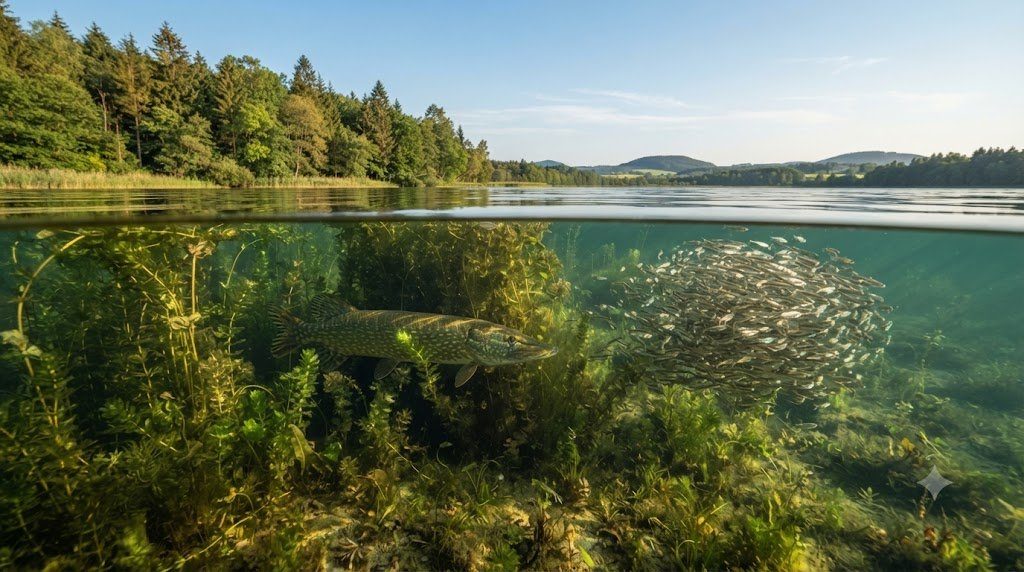
Biomanipulation restructures the top-down food chain: managers remove planktivorous minnows (or stock apex predators like northern pike). Relieved of fish predation, populations of large-bodied Daphnia zooplankton explode, and their voracious filter-feeding grazes unicellular green algae out of the water column, restoring crystal-clear water.
Can an environmental DNA (eDNA) test tell you how many fish are in a river?
While eDNA qPCR reliably detects species presence or absence with extreme sensitivity, calculating exact numerical fish population abundance remains challenging. DNA shedding rates vary with fish age, water temperature, and breeding stress, while downstream current velocity and clay adsorption alter DNA transport. However, higher eDNA copy concentrations strongly correlate with higher relative biomass in controlled river reaches.