For decades, aquatic ecology operated under the assumption that the biological productivity and water clarity of lakes were governed strictly from the bottom up—dictated solely by the availability of solar energy and dissolved nutrients (the Bottom-Up Resource Regulation Model). However, in 1985, Dr. Stephen R. Carpenter and his colleagues at the University of Notre Dame demonstrated an equally powerful opposing force: Top-Down Trophic Cascades. Altering the top apex predators at the pinnacle of a lake food web reverberates through every intermediate trophic tier, dramatically altering zooplankton grazing rates and even shifting whether lake water appears crystal clear or pea-soup green.
Simultaneously, traditional food web models completely ignored the microscopic universe that recycles over 50% of the carbon fixed in pelagic waters: the Microbial Loop. In this monograph, we analyze the classic four-tier trophic cascade, the ecophysiology of large-bodied Daphnia grazers, Biomanipulation lake restoration engineering, and the carbon flux kinetics of the microbial loop.
The Mechanics of a Four-Tier Pelagic Trophic Cascade
In a deep, temperate lake, pelagic organisms organize into four primary trophic levels:
- Trophic Level 4 (Apex Piscivores): Top predatory fish, such as Northern Pike (Esox lucius), Walleye (Sander vitreus), and Largemouth Bass (Micropterus salmoides).
- Trophic Level 3 (Planktivores / Forage Fish): Visual-feeding small fish that consume zooplankton, such as Alewives (Alosa pseudoharengus), Bluegills (Lepomis macrochirus), and Fathead Minnows.
- Trophic Level 2 (Herbivorous Zooplankton): Microscopic crustaceans, dominated by large-bodied cladocerans (genus Daphnia, such as Daphnia magna and D. pulicaria) and copepods.
- Trophic Level 1 (Primary Producers / Phytoplankton): Single-celled and colonial microalgae, including diatoms, chlorophytes, and cyanobacteria.
Top-Down Cascading Perturbations: High vs. Low Piscivore Scenarios
Notice what happens when the apex piscivore population changes:
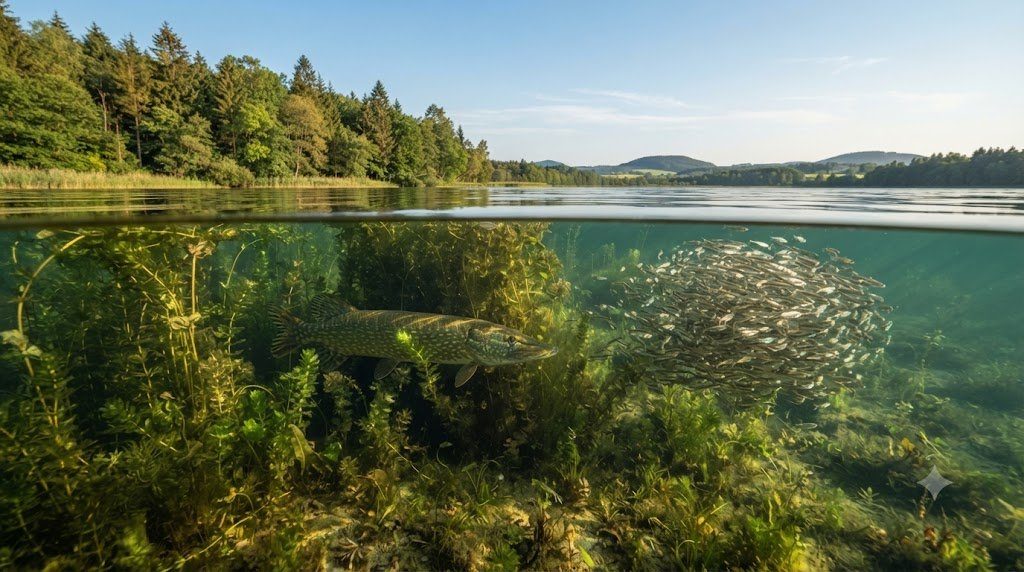
- Scenario A: Abundant Apex Piscivores (The Clear-Water State): High numbers of Northern Pike heavily consume planktivorous forage fish. With forage fish depressed, predation pressure on zooplankton drops to near-zero. Massive populations of large-bodied Daphnia explode! A single large Daphnia can filter over 50 mL of lake water per day. The zooplankton swarm grazes the phytoplankton population down to near-zero, creating the famous Spring Clear-Water Phase where Secchi disk visibility reaches 8+ meters!
- Scenario B: Overfished Apex Piscivores (The Murky Green State): When overfishing removes apex pike, planktivorous forage fish reproduce unchecked. Swarms of minnows devour every large Daphnia in the lake, leaving only tiny rotifers and small copepods that cannot efficiently filter large algae. Relieved of grazing pressure, phytoplankton blooms explode into massive green scums—even without any increase in nutrient loading!
Biomanipulation: Restoring Water Clarity Through Food-Web Engineering
In 1975, limnologist Joseph Shapiro proposed Biomanipulation: using top-down trophic cascade ecology as an active lake restoration technology. Rather than applying expensive toxic chemical algaecides (like copper sulfate), biomanipulation managers execute two biological interventions:
- Rotenone or Intensive Commercial Netting of Planktivores: Eradicating or drastically culling populations of planktivorous carp and shad.
- Mass Stocking of Apex Piscivore Fingerlings: Stocking thousands of apex predator fingerlings (walleye, pike, tiger muskie) to enforce permanent top-down control over remaining forage fish, allowing Daphnia to rebound and restore crystal-clear water indefinitely.
| Trophic State / Scenario | Apex Piscivore Density | Planktivorous Fish Density | Daphnia Zooplankton Biomass | Phytoplankton Biomass & Water Clarity |
|---|---|---|---|---|
| Clear-Water Equilibrium | High (Dominant Pike/Walleye) | Suppressed / Low Density | High (Dominated by large Daphnia) | Extremely Low / Crystal Clear (Secchi > 5m) |
| Turbid Eutrophic State | Depleted / Overfished | Hyper-Abundant Minnows/Shad | Near-Zero (Only tiny rotifers survive) | Severe Algal Bloom / Murky Pea-Soup (Secchi < 1m) |
| Post-Biomanipulation Success | Artificially Restocked | Crashed via Netting & Predation | Explosive Rebound (Filter-feeding) | Rapid Recovery of Clarity; SAV macrophyte return |
The Microbial Loop: Carbon Salvage in the Pelagic Zone
In classical food chain theory, carbon flows linearly: Phytoplankton $\rightarrow$ Zooplankton $\rightarrow$ Fish. However, in 1983, Farooq Azam and colleagues identified the Microbial Loop. Up to 50% of the carbon fixed during algal photosynthesis leaks out of healthy cells or bursts during viral lysis as Dissolved Organic Carbon (DOC), completely inaccessible to crustacean zooplankton.
Heterotrophic pelagic bacteria absorb this dissolved carbon, building bacterial biomass. The bacteria are consumed by tiny heterotrophic flagellates (ciliates and nanoflagellates), which are in turn eaten by microzooplankton, which are finally consumed by Daphnia! The microbial loop functions as an essential carbon salvage pathway, packaging dissolved organic leaks back into edible microscopic cellular packets that re-enter the main metazoan food web.
Diel Vertical Migration (DVM) in Pelagic Zooplankton
In clear temperate lakes containing visual-feeding planktivorous fish, large-bodied zooplankton (specifically Daphnia and copepods) execute the largest daily biomass migration on Earth: Diel Vertical Migration (DVM).
To avoid being eaten by visual-hunting minnows during daylight, Daphnia migrate at dawn down into the dark, cold hypolimnion (often 10 to 30 meters deep), where ambient light is zero and water temperatures hover near 4°C to 8°C. At dusk, under the cover of darkness, the zooplankton swarm swims vertically upward into the warm, food-rich epilimnion to graze intensively on phytoplankton all night, descending back into the deep abyss before sunrise. This daily migration functions as a massive active biological pump, transporting organic carbon and phosphorus across the thermocline into deep waters.
Viral Shunt Mechanics in Freshwater Pelagic Systems
Within the microbial loop, aquatic viruses (specifically bacteriophages and cyanophages) outnumber all cellular organisms, reaching concentrations of $10^7$ to $10^8$ viral particles per milliliter of lake water! Every day, viral infection lyses and kills approximately 10% to 20% of the entire pelagic bacterial and cyanobacterial population. This continuous cellular bursting (the Viral Shunt) short-circuits carbon flow: instead of bacterial carbon passing up the food chain to flagellates and zooplankton, cell lysis spills organic cytoplasm back into the dissolved organic carbon (DOC) pool, fueling further bacterial respiration and recycling nutrients locally.
Stoichiometric Food Quality: The Phosphorus-Carbon (P:C) Bottleneck
In pelagic aquatic food webs, consumer growth is constrained not merely by total calories of food, but by the elemental stoichiometry of that food. Ecological Stoichiometry models developed by Dr. Robert Sterner and Dr. James Elser demonstrate the profound Phosphorus-to-Carbon (P:C) Bottleneck in zooplankton nutrition.
Fast-growing cladocerans (genus Daphnia) maintain a high, strictly homeostatic phosphorus content (approx. 1.5% to 2.0% P by dry weight) because their rapid growth requires massive quantities of phosphorus-rich ribosomal RNA (rRNA). In contrast, slower-growing calanoid copepods are rich in nitrogen (structural chitin) and maintain very low phosphorus content (approx. 0.5% P). When a lake undergoes nutrient depletion and green algae have low P:C ratios, Daphnia suffer severe phosphorus starvation—their growth and egg production stall even when their guts are bursting with green algal cells! Conversely, copepods thrive on low-phosphorus diets, shifting the balance of the zooplankton community.
Mixotrophy: Ecological Bridge Between Autotrophy and Heterotrophy
Modern limnology increasingly recognizes that the boundary between ‘algae’ (plants) and ‘protozoa’ (animals) is fluid. Many dominant pelagic flagellates (such as Dinobryon, Cryptomonas, and Ceratium) are mixotrophs: they carry chloroplasts and photosynthesize using sunlight when dissolved nutrients are high, but switch to predatory phagotrophy—ingesting and eating bacteria—when dissolved phosphorus is scarce or when winter ice blocks sunlight, bridging the microbial loop and metazoan food web.
Viral Shunt Dynamics: Top-Down Lytic Control on Aquatic Bacteria
Within the pelagic microbial loop, heterotrophic bacteria and picocyanobacteria are regulated not only by protozoan bacterivory, but by ubiquitous aquatic bacteriophages via the viral shunt. Freshwater lakes harbor staggering viral concentrations, typically ranging from 10 million to over 100 million viral particles per milliliter of water. Lytic phage infections trigger cell lysis in up to 30% of the ambient bacterial population daily, bursting microbial cell walls and instantly converting living bacterial particulate organic matter back into dissolved organic matter (DOM). Rather than flowing up into higher trophic levels (zooplankton and fish), this organic carbon is short-circuited and recycled within the microbial loop, stimulating intense local heterotrophic respiration.
Aquatic Ecological Survey Protocols and Laboratory Bioassessment
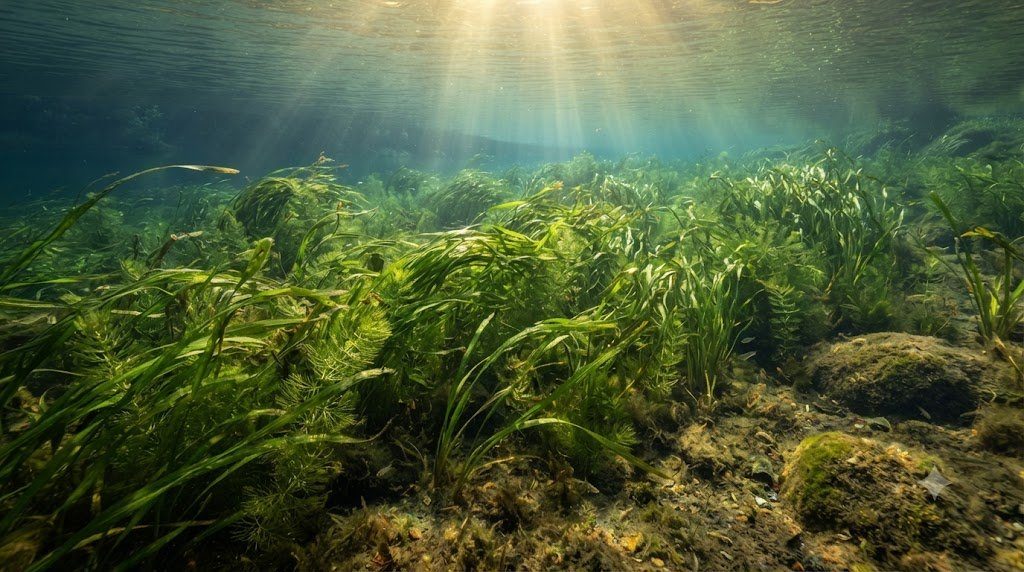
Operationalizing the principles of Freshwater Trophic Cascades and Microbial Loops in environmental impact assessments and conservation biology requires disciplined taxonomic rigor. Ecological communities fluctuate seasonally: benthic insects emerge as winged adults, zooplankton undergo boom-and-bust predator cycles, and submerged aquatic vegetation senesces in autumn.
A professional freshwater bioassessment integrates macroinvertebrate kick-net transects, pelagic zooplankton vertical tows, macrophyte rake surveys, and molecular environmental DNA filtering. Use the standardized bioassessment execution matrix below.
| Biological Assemblage | Sampling Hardware / Method | Field Collection Standard | Laboratory Taxonomic Processing | Ecological Metric & Assessment Index |
|---|---|---|---|---|
| Benthic Macroinvertebrates | 500-micron D-frame kick net | 1.0 m² riffle cobble kick (60 seconds); 3 replicates per reach | Sub-sample 300 organisms in Caton grid tray; identify to genus/species | EPT Richness, Hilsenhoff Biotic Index (HBI), B-IBI multi-metric score |
| Pelagic Zooplankton | 80-micron Wisconsin plankton net | Vertical tow from 1m above bottom to surface @ 0.5 m/s | Enumerate cladocerans, copepods, and rotifers in Sedgewick-Rafter cell | Daphnia biomass density; mean zooplankton body length (Trophic cascade metric) |
| Phytoplankton / Microalgae | Integrated 2-meter PVC euphotic hose sampler | Collect composite water across euphotic zone; preserve w/ Lugol’s iodine | Utermöhl inverted microscope settling chamber count @ 400x magnification | Chlorophyll-a concentration (μg/L); Cyanobacteria relative abundance (% HAB) |
| Submerged Macrophytes (SAV) | Double-sided metal sampling rake on pole/rope | Deploy rake along 100m transect lines at 1m depth increments | Estimate species percent cover; measure dry biomass (g/m²) | Floristic Quality Index (FQI); native vs. invasive macrophyte ratio |
| Environmental DNA (eDNA) | Peristaltic pump + 0.45μm PES capsule filter | Filter 1.0 to 2.0 L surface water; inject Longmire’s lysis buffer | Clean-room extraction; targeted TaqMan qPCR or NGS metabarcoding | Species presence/absence detection; absolute mitochondrial copy concentration |
Microscopic Enumeration Protocols in the Limnological Laboratory
Accurate quantification of microscopic aquatic communities requires specialized counting chambers and magnification optics:
- Sedgewick-Rafter Cell (Zooplankton & Large Algae): A glass slide holding exactly 1.0 milliliter of sample in a 50x20x1 mm chamber ruled into 1,000 grids. Examined at 100x to 200x magnification to calculate organisms per liter: $N = (C \cdot 1000) / (A \cdot D \cdot F)$, where $C$ is count and $F$ is concentration factor.
- Palmer-Maloney Cell (Nannoplankton): A shallow circular ceramic chamber holding 0.1 mL, optimized for high-power 400x phase-contrast identification of small flagellates and diatoms.
- Utermöhl Sedimentation Chambers: Water samples preserved with Lugol’s iodine settle by gravity down a vertical glass cylinder over 24 hours onto a thin glass coverslip, scanned from below using an inverted research microscope.
Frequently Asked Questions Concerning Freshwater Ecosystems & Bioindicators
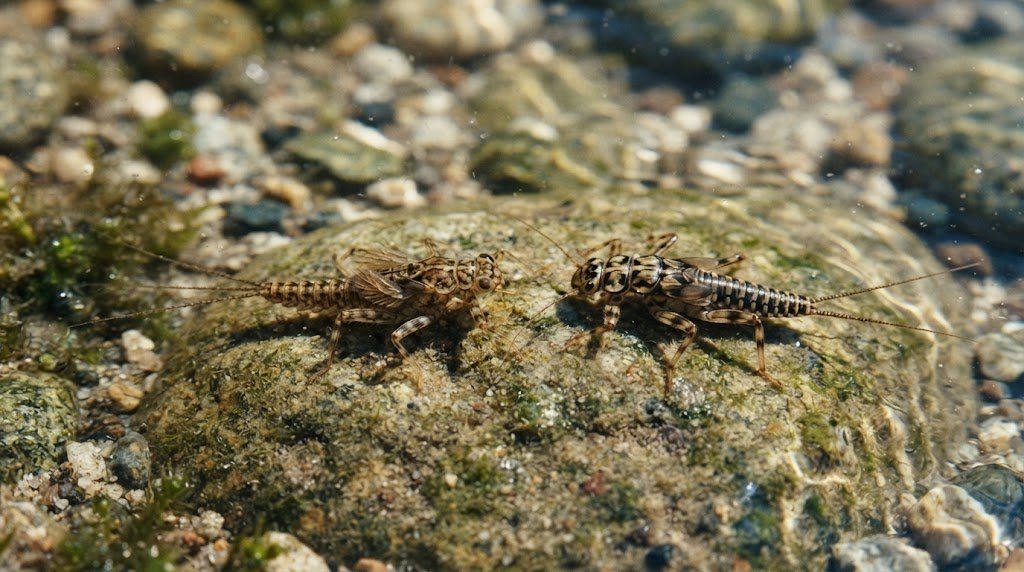
Why are stoneflies (Plecoptera) the first group to disappear when a stream is polluted?
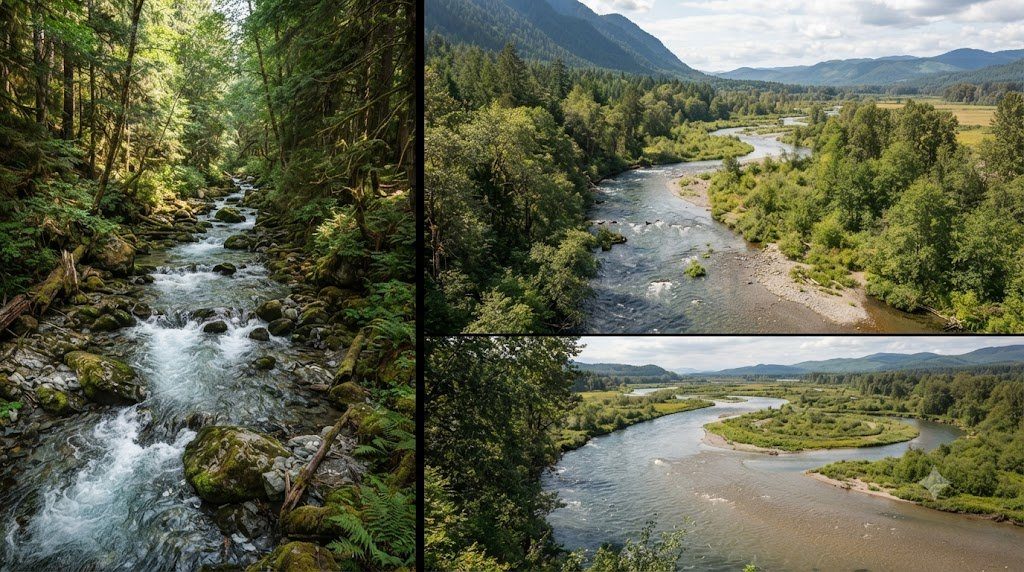
Stoneflies are coldwater stenotherms adapted to roaring mountain streams. Unlike tolerant insects that possess hemoglobin or breathe atmospheric air through siphons, stoneflies rely entirely on delicate external gills and cutaneous gas exchange. Even slight drops in dissolved oxygen or spikes in temperature suffocate them, making them the ultimate canaries in the coal mine for stream degradation.
How does biomanipulation clear a green, murky lake?
Biomanipulation restructures the top-down food chain: managers remove planktivorous minnows (or stock apex predators like northern pike). Relieved of fish predation, populations of large-bodied Daphnia zooplankton explode, and their voracious filter-feeding grazes unicellular green algae out of the water column, restoring crystal-clear water.
Can an environmental DNA (eDNA) test tell you how many fish are in a river?
While eDNA qPCR reliably detects species presence or absence with extreme sensitivity, calculating exact numerical fish population abundance remains challenging. DNA shedding rates vary with fish age, water temperature, and breeding stress, while downstream current velocity and clay adsorption alter DNA transport. However, higher eDNA copy concentrations strongly correlate with higher relative biomass in controlled river reaches.