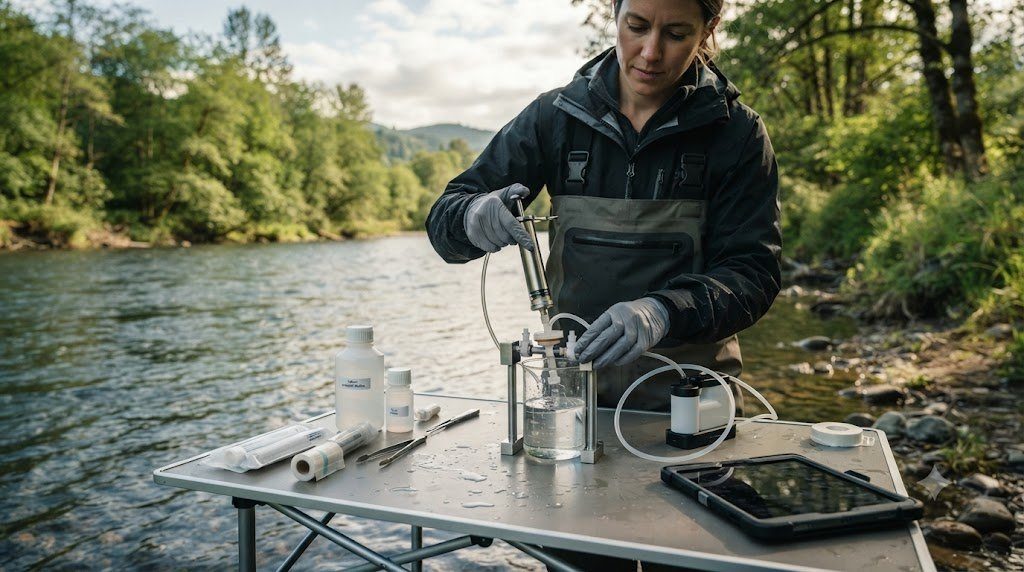
For over a century, cataloging the biodiversity of freshwater ecosystems required intensive, destructive, and physically demanding field surveys: dragging heavy bottom-trawls across lake beds, setting gill nets that kill fish, shocking mountain streams with backpack electrofishers, and spending weeks peering through stereomicroscopes trying to identify mutilated insect larvae. Yet despite exhaustive effort, cryptic, rare, endangered, or newly arrived invasive species frequently eluded detection until populations collapsed or exploded beyond control.
Over the past decade, a revolutionary molecular technology has rewritten the rules of aquatic ecology: Environmental DNA (eDNA) Surveillance. Every living organism inhabiting a river, lake, or groundwater aquifer continuously sheds microscopic genetic material—sloughed epithelial skin cells, scales, mucus, gametes, and metabolic waste—into the surrounding water column. By filtering a single liter of river water through a microscopic pore membrane, extracting total genomic DNA, and executing targeted quantitative Polymerase Chain Reaction (qPCR) or high-throughput eDNA Metabarcoding, scientists can detect the presence of a single invasive carp or endangered hellbender salamander miles upstream with near-100% sensitivity.
The Physical and Chemical State of eDNA in Aquatic Matrices
In freshwater environments, macrobial eDNA exists in three distinct physical states:
- Intracellular eDNA: Contained inside intact, sloughed eukaryotic cells, cell organelles (mitochondria and nuclei), or tissue fragments. Ranging from 1 to 10 microns in size, this fraction is easily captured on standard glass fiber or polycarbonate filter membranes.
- Extracellular Particulate eDNA: Adsorbed onto suspended clay minerals, organic humic colloids, or extracellular vesicles (exosomes).
- Free Dissolved eDNA: Naked double-stranded DNA fragments floating freely in solution. Extremely vulnerable to enzymatic degradation by extracellular DNase enzymes.
The Environmental Degradation Clock: Why eDNA Signals Are Fresh
A common skepticism of eDNA is: How do we know the detected DNA wasn’t deposited 50 years ago? Unlike ancient DNA preserved inside permafrost bones, eDNA in warm, biologically active freshwater degrades rapidly! Solar ultraviolet (UV-B) radiation, hydrolytic depurination, and microbial DNase enzymes cleave DNA strands into unamplifiable fragments within 24 to 72 hours (rarely persisting past 7 to 14 days in temperate summer waters). Consequently, detecting an eDNA signal confirms that the organism was physically present in the immediate catchment within the past few days!
Laboratory Workflow: From River Water to Genomic Sequence
Executing a forensic-grade eDNA surveillance campaign follows four strict laboratory stages:
| eDNA Laboratory Stage | Instrumentation / Protocol | Critical Procedural Safeguard | Primary Objective |
|---|---|---|---|
| 1. Field Filtration | Peristaltic pump + 0.45μm or 1.2μm PES capsule filter | Sterile surgical gloves changed between every single water sample | Concentrate suspended cellular material from 1 to 3 liters of water |
| 2. Preservation | Lysis buffer injection (Longmire’s / ATL) or flash-freezing | Shield samples from heat and UV radiation immediately | Inactivate ambient DNase enzymes and halt DNA hydrolysis |
| 3. Extraction & Purification | Magnetic-bead or silica-column extraction (e.g., DNeasy) | Clean-room environment; zero PCR products ever enter room | Isolate ultra-pure genomic DNA while removing PCR inhibitors (Humic acids) |
| 4. Targeted qPCR / ddPCR | TaqMan minor-groove-binder (MGB) fluorescent probe assays | Include internal positive controls (IPC) & negative field blanks | Quantify exact target copy numbers per liter for single target species |
| 5. High-Throughput Metabarcoding | Illumina NovaSeq / MiSeq high-throughput NGS platform | Dual-indexed universal primer tags (e.g., MiFish 12S primers) | Simultaneously identify entire vertebrate or invertebrate community! |
Targeted qPCR vs. High-Throughput eDNA Metabarcoding
Freshwater scientists select between two powerful molecular detection platforms depending on management goals:
- Targeted Quantitative PCR (qPCR) and Droplet Digital PCR (ddPCR): Designed for single-species forensic surveillance (such as detecting invasive Asian carp, silver carp, or zebra mussels at the invasion front). Uses species-specific forward and reverse primers coupled with a fluorophore-quenched TaqMan probe that anneals exclusively to a unique 80-to-150 base-pair sequence of the target genome. It provides absolute target copy counts down to single-molecule detection thresholds!
- High-Throughput eDNA Metabarcoding: Designed for whole-ecosystem biodiversity monitoring. Uses ‘universal’ primers targeting conserved regions flanking hypervariable barcodes (such as the MiFish 12S mitochondrial gene). Next-generation sequencers generate millions of reads, which are cross-referenced against global reference databases (NCBI GenBank) to generate a comprehensive taxonomic census of every fish, amphibian, and macroinvertebrate present in the river!
Addressing PCR Inhibition and False Positives in Environmental Samples
The greatest technical challenge in freshwater eDNA analysis is chemical PCR inhibition. Freshwater samples from bogs and forested streams are rich in dissolved humic and fulvic acids (polyphenolic breakdown products of plant lignin). Humic acids co-purify with DNA and directly bind to Taq polymerase enzymes, causing catastrophic false-negative results! Modern laboratories overcome this by running Internal Positive Controls (IPC)—spiking every reaction with a known synthetic DNA target—and utilizing specialized inhibitor-removal magnetic bead resins (such as Zymo OneStep-96 PCR Inhibitor Removal columns), unlocking the full power of molecular limnology for global freshwater conservation.
Droplet Digital PCR (ddPCR) for Absolute Target Quantification
While standard quantitative real-time PCR (qPCR) relies on comparison against standard calibration curves, cutting-edge eDNA laboratories have adopted Droplet Digital PCR (ddPCR). In ddPCR, a 20-microliter reaction mixture is emulsified into an oil carrier, partitioning the sample into exactly 20,000 microscopic water-in-oil nanoliter droplets.
Each individual droplet undergoes end-point PCR thermal cycling as an isolated micro-reactor. A two-color optical fluorescence reader streams the droplets single-file past a laser, scoring each droplet as either positive (containing target eDNA) or negative (containing zero target molecules). Applying Poisson statistics to the ratio of positive to negative droplets yields absolute target copy counts per liter without requiring external standard curves—delivering unprecedented sensitivity that can detect a single invasive fish genome in 5 liters of murky river water!
Transport and Shedding Dynamics: Modeling River eDNA Plumes
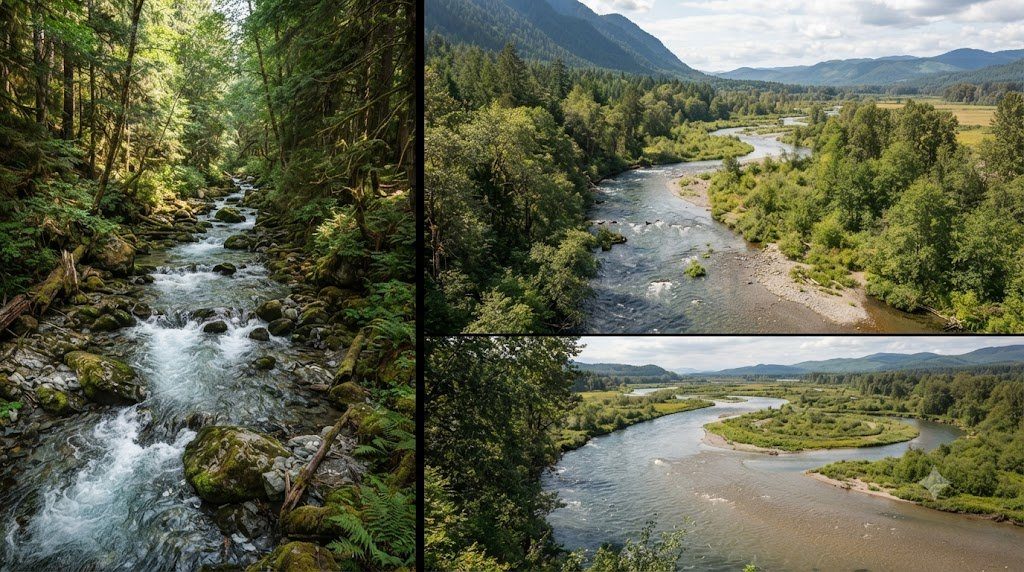
In lotic river environments, eDNA is not static; it travels downstream with the current while settling onto sediment beds and degrading. Hydrologists model downstream eDNA transport using advection-dispersion-decay equations: a large organism (such as an adult Asian carp) typically sheds $10^6$ to $10^8$ DNA copies per hour. In clear gravel streams, the detectable eDNA plume typically extends 1.0 to 10 kilometers downstream of the living animal before dropping below molecular detection thresholds, providing wildlife managers with exact catchment-scale boundaries for invasive species eradication.
Occupancy Modeling: Estimating Detection Probability (p) and Occupancy (ψ)
In environmental DNA surveillance, a negative PCR result does not guarantee that an organism is 100% absent; it may simply mean that the concentration of shed eDNA fell below the assay’s Limit of Detection (LOD). To account for false negatives in a statistically defensible framework, biostatisticians utilize Site-Occupancy Modeling (MacKenzie et al., 2002):
L(ψ, p) = ∏ [ψ * ∏ py * (1 – p)(1 – y) + (1 – ψ)]
Where $\psi$ is the true probability of species occupancy at a lake or river site, and $p$ is the conditional detection probability given that the species is present. By collecting multiple spatial water samples (typically 3 to 5 filtration replicates per site) and running multiple technical PCR replicates (typically 4 to 8 qPCR wells per sample), occupancy models estimate true detection probabilities ($p > 0.95$), allowing natural resource agencies to declare a watershed ‘invasive-free’ or confirm eradication success with 95% statistical confidence.
Autonomous Robotic Sampling: Subsurface eDNA Autosamplers
The cutting edge of molecular limnology is the deployment of autonomous underwater robotic eDNA samplers (such as the Monterey Bay Aquatic Environmental DNA Sampler, ESP, and autonomous drone boats). Anchored in remote river gorges or floating on offshore lake buoys, these solar-powered robotic systems draw water through multi-port filter wheels on programmable schedules (e.g., every 6 hours during fish migration pulses), automatically inject preservation buffers, and transmit telemetry data via satellite, revolutionizing biodiversity monitoring in inaccessible aquatic ecosystems.
Inhibition Mitigation: Quantitative Internal Positive Controls (IPC)
A paramount analytical challenge in environmental DNA monitoring from organic-rich wetlands and turbid rivers is enzymatic PCR inhibition. Humic acids, fulvic acids, tannic compounds, and bile salts co-extracted with target DNA bind directly to DNA polymerase enzymes, yielding false-negative amplification curves. Rigorous molecular quality assurance protocols overcome this obstacle by spiking each analytical reaction well with an Internal Positive Control (IPC)—a synthetic, non-target exogenous DNA oligonucleotide paired with a distinct fluorophore probe (such as VIC or Cy5). If the IPC fails to amplify at its expected cycle threshold ($C_t$), laboratory technicians immediately identify severe enzymatic inhibition and subject the extract to secondary magnetic-bead cleanups or tenfold dilutions, ensuring complete data integrity.
Aquatic Ecological Survey Protocols and Laboratory Bioassessment
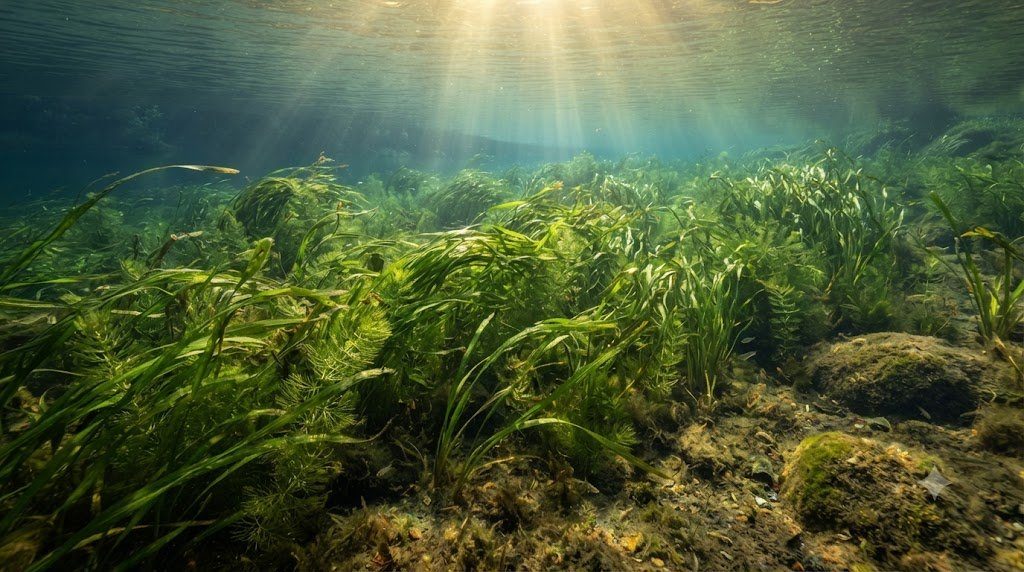
Operationalizing the principles of Freshwater Environmental DNA (eDNA) Surveillance in environmental impact assessments and conservation biology requires disciplined taxonomic rigor. Ecological communities fluctuate seasonally: benthic insects emerge as winged adults, zooplankton undergo boom-and-bust predator cycles, and submerged aquatic vegetation senesces in autumn.
A professional freshwater bioassessment integrates macroinvertebrate kick-net transects, pelagic zooplankton vertical tows, macrophyte rake surveys, and molecular environmental DNA filtering. Use the standardized bioassessment execution matrix below.
| Biological Assemblage | Sampling Hardware / Method | Field Collection Standard | Laboratory Taxonomic Processing | Ecological Metric & Assessment Index |
|---|---|---|---|---|
| Benthic Macroinvertebrates | 500-micron D-frame kick net | 1.0 m² riffle cobble kick (60 seconds); 3 replicates per reach | Sub-sample 300 organisms in Caton grid tray; identify to genus/species | EPT Richness, Hilsenhoff Biotic Index (HBI), B-IBI multi-metric score |
| Pelagic Zooplankton | 80-micron Wisconsin plankton net | Vertical tow from 1m above bottom to surface @ 0.5 m/s | Enumerate cladocerans, copepods, and rotifers in Sedgewick-Rafter cell | Daphnia biomass density; mean zooplankton body length (Trophic cascade metric) |
| Phytoplankton / Microalgae | Integrated 2-meter PVC euphotic hose sampler | Collect composite water across euphotic zone; preserve w/ Lugol’s iodine | Utermöhl inverted microscope settling chamber count @ 400x magnification | Chlorophyll-a concentration (μg/L); Cyanobacteria relative abundance (% HAB) |
| Submerged Macrophytes (SAV) | Double-sided metal sampling rake on pole/rope | Deploy rake along 100m transect lines at 1m depth increments | Estimate species percent cover; measure dry biomass (g/m²) | Floristic Quality Index (FQI); native vs. invasive macrophyte ratio |
| Environmental DNA (eDNA) | Peristaltic pump + 0.45μm PES capsule filter | Filter 1.0 to 2.0 L surface water; inject Longmire’s lysis buffer | Clean-room extraction; targeted TaqMan qPCR or NGS metabarcoding | Species presence/absence detection; absolute mitochondrial copy concentration |
Microscopic Enumeration Protocols in the Limnological Laboratory
Accurate quantification of microscopic aquatic communities requires specialized counting chambers and magnification optics:
- Sedgewick-Rafter Cell (Zooplankton & Large Algae): A glass slide holding exactly 1.0 milliliter of sample in a 50x20x1 mm chamber ruled into 1,000 grids. Examined at 100x to 200x magnification to calculate organisms per liter: $N = (C \cdot 1000) / (A \cdot D \cdot F)$, where $C$ is count and $F$ is concentration factor.
- Palmer-Maloney Cell (Nannoplankton): A shallow circular ceramic chamber holding 0.1 mL, optimized for high-power 400x phase-contrast identification of small flagellates and diatoms.
- Utermöhl Sedimentation Chambers: Water samples preserved with Lugol’s iodine settle by gravity down a vertical glass cylinder over 24 hours onto a thin glass coverslip, scanned from below using an inverted research microscope.
Frequently Asked Questions Concerning Freshwater Ecosystems & Bioindicators
Why are stoneflies (Plecoptera) the first group to disappear when a stream is polluted?
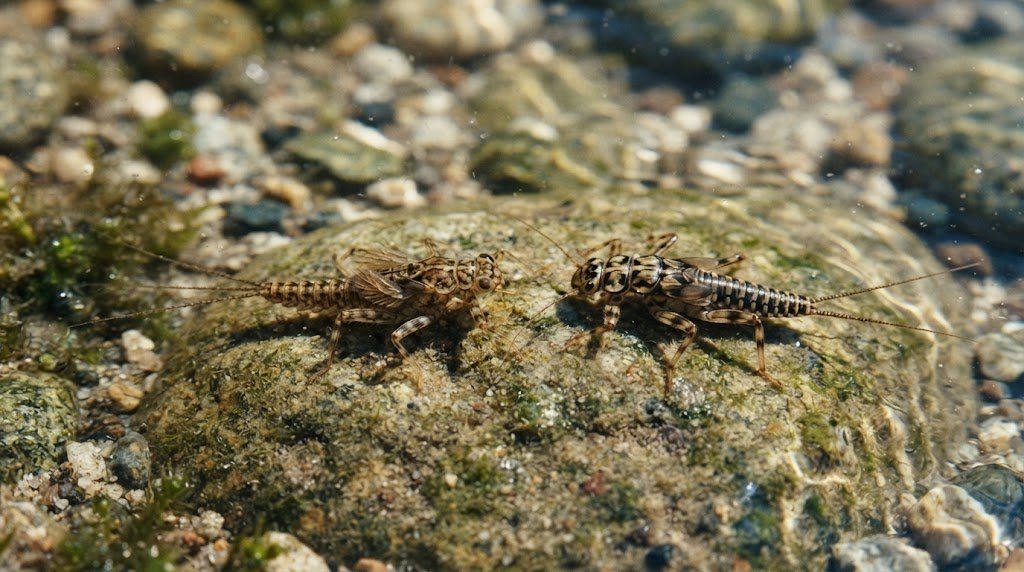
Stoneflies are coldwater stenotherms adapted to roaring mountain streams. Unlike tolerant insects that possess hemoglobin or breathe atmospheric air through siphons, stoneflies rely entirely on delicate external gills and cutaneous gas exchange. Even slight drops in dissolved oxygen or spikes in temperature suffocate them, making them the ultimate canaries in the coal mine for stream degradation.
How does biomanipulation clear a green, murky lake?
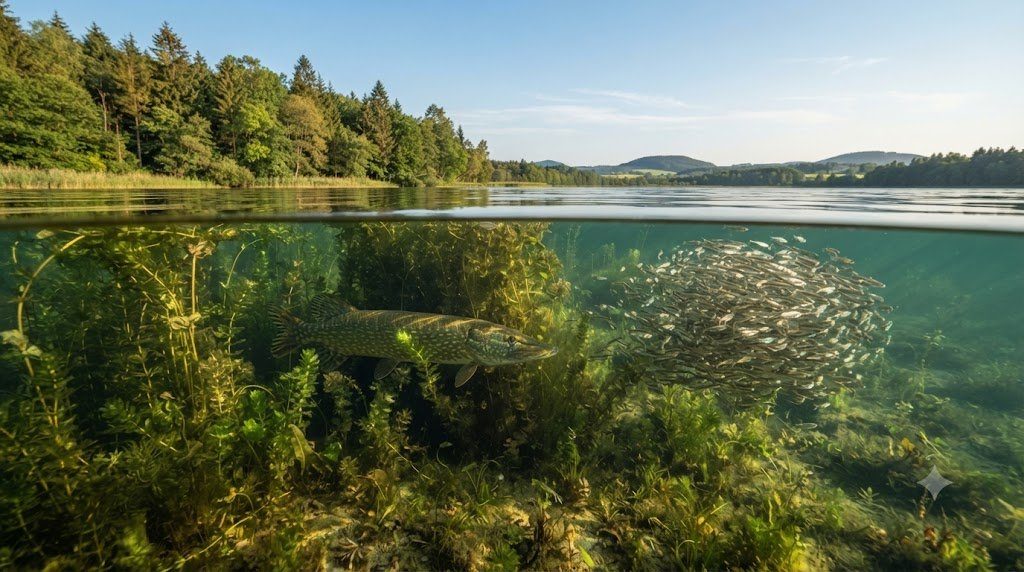
Biomanipulation restructures the top-down food chain: managers remove planktivorous minnows (or stock apex predators like northern pike). Relieved of fish predation, populations of large-bodied Daphnia zooplankton explode, and their voracious filter-feeding grazes unicellular green algae out of the water column, restoring crystal-clear water.
Can an environmental DNA (eDNA) test tell you how many fish are in a river?
While eDNA qPCR reliably detects species presence or absence with extreme sensitivity, calculating exact numerical fish population abundance remains challenging. DNA shedding rates vary with fish age, water temperature, and breeding stress, while downstream current velocity and clay adsorption alter DNA transport. However, higher eDNA copy concentrations strongly correlate with higher relative biomass in controlled river reaches.